Fence Logs

Why Fence Logs?

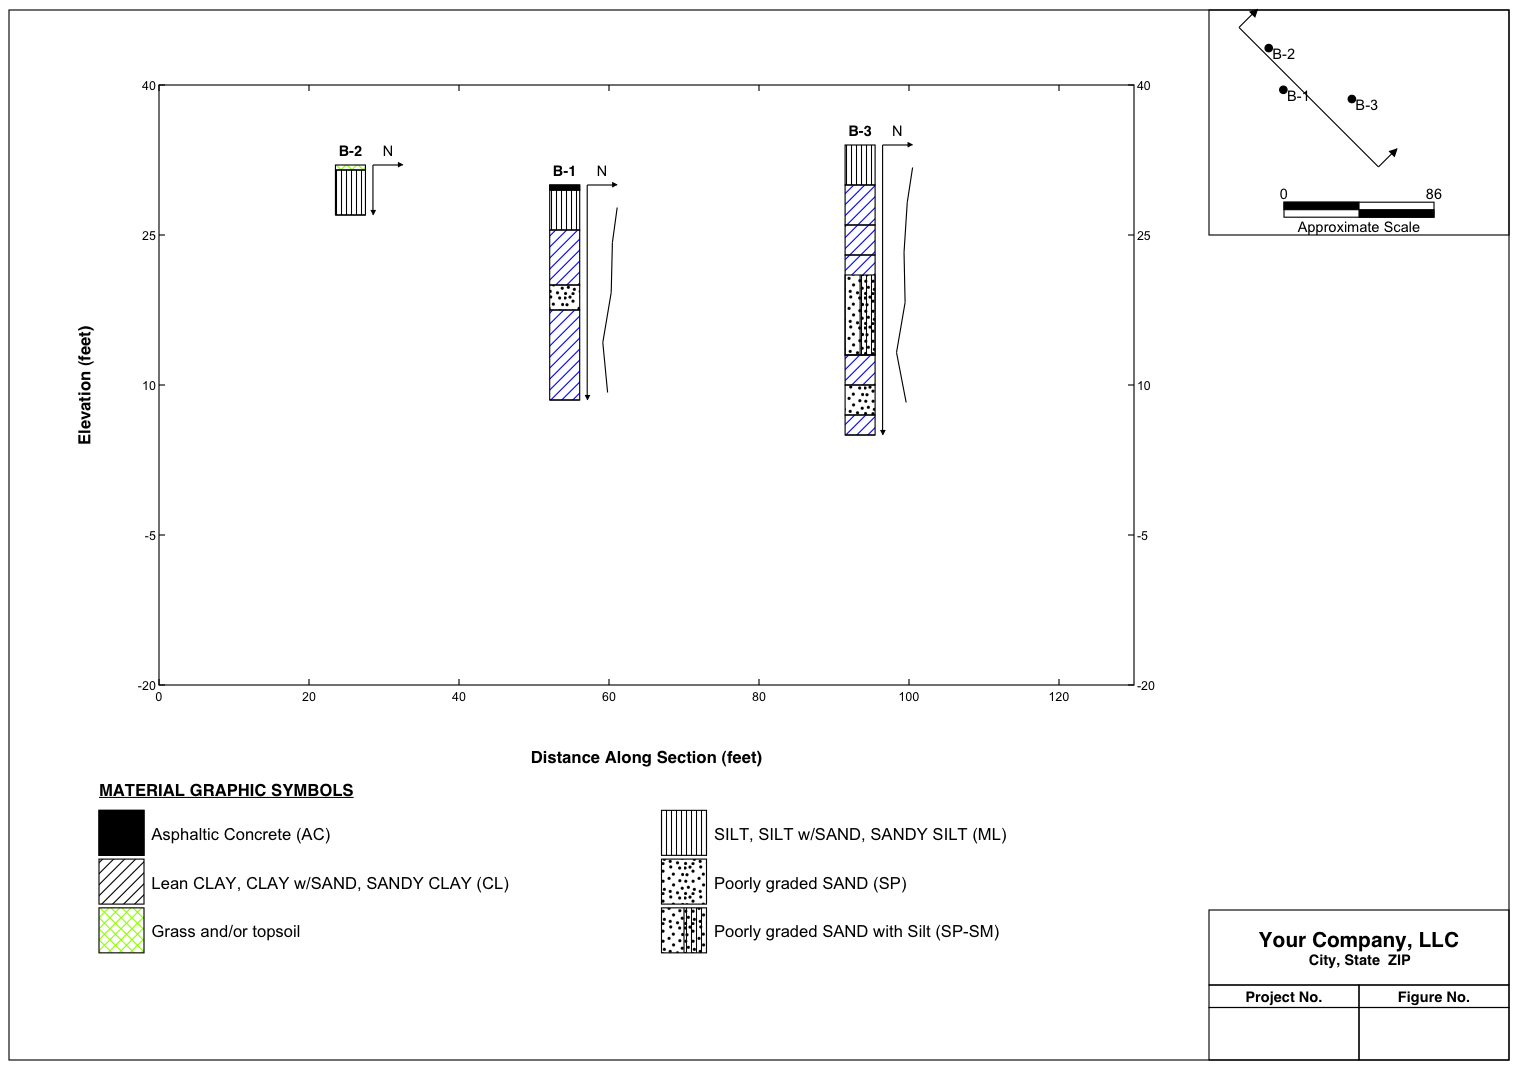
Sometimes it is helpful to visualize the subsurface conditions by viewing the log data in "fence log" format, as shown below (with an optional graph of measured blow counts alongside the log, a basic site plan, and a key to material graphic symbols). 

Once the boring log data have been entered, some or all of the logs in a given project file may be viewed as a fence log by selecting "File-Print Fence Log" or clicking the "Fence Log" button on the toolbar.  This will bring up the options window, which has six tabs:

(back to top)

Coordinates

The first tab is used to enter the log coordinates and fence endpoints.

Log Coordinates Grid

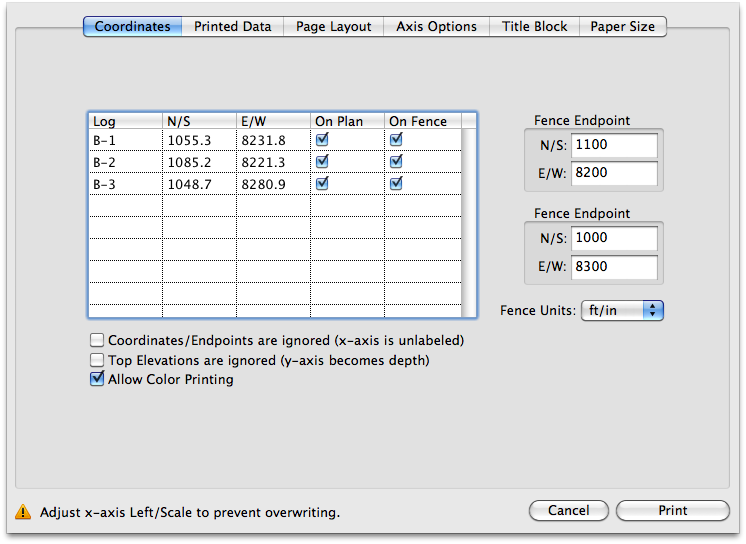
The log coordinates should be entered in consistent units with each other and the fence endpoints.  The logs can be removed from the plan and/or the fence diagrams by unchecking the appropriate boxes.  The coordinates and options will be saved when saving the data file.

Fence Endpoints

The fence endpoints must be entered in the same units as the log coordinates.  If you were standing on the fence line, the upper endpoint would be to your left and the lower endpoint would be to your right.

Fence Units

The fence units pulldown defines what units are printed on the fence diagram.  Changing this does not affect the data, it only affects the text printed ("feet" or "meters").

Coordinates/Endpoints are ignored

When coordinates and fence endpoints are ignored, the logs will be printed as fence logs but they will be evenly distributed across the page and will not have a horizontal scale.  The x-axis will be unlabeled in this case.

Top Elevations are ignored

If the top elevations are ignored, all logs on the fence diagram will start at the same vertical position on the page and the y-axis will be labeled as "depth" instead of "elevation."

Allow Color Printing

If you would like to print in color, make sure the "Allow Color Printing" box is checked.  For printers that do not support color output, you may wish to uncheck this box if grayscale printing results in poor output quality.

(back to top)

Printed Data

The Printed Data tab is used to define which data are printed alongside each log.

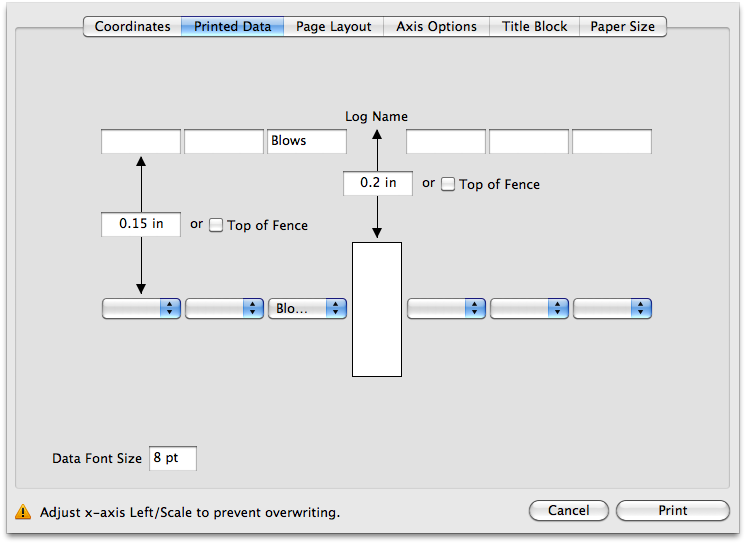
In the above screen capture, the blow counts will be printed to the left side of the log.  The log name (for example, "B-1") will be printed 0.2 inches above the top of the log, and the titles for the data columns will be printed 0.15 inches above the top of the log.  The data font size is 8pt.

Several data types can be printed:

USCS
Prints the USCS symbol for the soil layer.
Sample ID
Prints the sample ID at the correct depth.
Blows (value)
Prints the blow count text at the entered depth.
Blows (graph)
Prints a chart of blow count data alongside the log.  Useful for visualizing layers with low (or high) blow counts.
Water
Prints water symbols.
Well
Prints a simplified well log next to the boring.

Page Layout

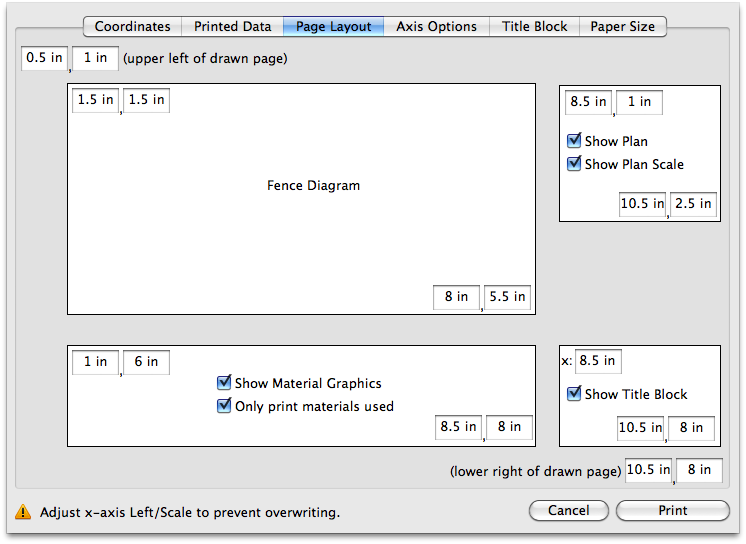
The Page Layout tab allows for viewing/editing the overall layout of the fence log.  The page layout information is defined in the template, but can be edited on a project-by-project basis.

Page
Define the upper left and lower right of the drawn page, relative to (0,0) being the upper left of the paper.  The maximum values for the lower right depend on the paper size chosen on the Paper Size tab.
Fence Diagram
This is the area reserved for the fence diagram axes (room must be left around this space for the axis labels).  In the above example, the y-axis will be 4 inches long and the x-axis will be 6.5 inches long.
Material Graphics
Use this section to show a key to material graphic symbols printed on the fence diagrams.  If "Only print materials used" is checked, only those materials printed will appear on the key.  If unchecked, all materials that print on the boring log key will be printed (this can result in too many materials printed).
Plan
If you want to print a basic site plan showing the location of the fence line and boring logs, make sure "Show Plan" is checked.  If you want to have a graphical scale in the plan area, check "Show Plan Scale."
Title Block
Use the title block to print project and company-specific information on the log.  The Title Block tab is used to define what is printed in these areas.
(back to top)

Axis Options

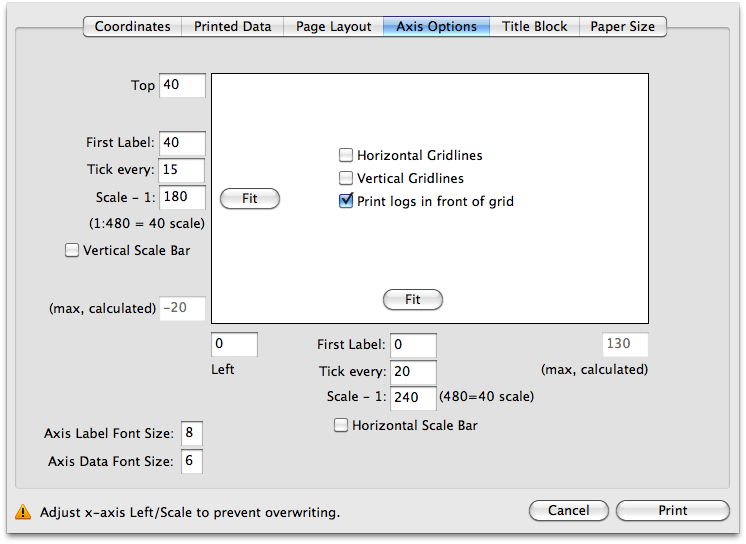
The Axis Options tab allows for customizing the fence diagram axes and font sizes.

General

Horizontal Gridlines
Print a horizontal gridline at every tick (defined on the y-axis).
Vertical Gridlines
Print a vertical gridline at every tick (defined on the x-axis).
Print logs in front of grid
Check this box to make sure logs print OVER the gridlines.  If they print behind the gridlines, some of the materials may be difficult to view.
Axis Label Font Size
Defines the font size for axis labels.
Axis Data Font Size
Defines the font size for axis data (such as depth values).

Axis Options

Left/Top
The first value along the axis.
First Label
The first PRINTED value along the axis.  Note that this may be different than the "Left" or "Top" value.  For instance, the "Left" value may be 2, but the first label may be 5.
Tick every
How often to print the tick marks.  This is in the units of the fence diagram, so a value of "20" will print a tick mark every 20 feet.
Scale
The scale of the log.  Note that this is in either inches:inches or centimeters:centimeters.  So to print a 40 scale (1" = 40'), enter 480 in the scale box (1" = 480").
Fit
If you just want to fit the data into the fence diagram area and don't need an even scale value, click the Fit button.  If the log coordinates or fence endpoint data changes, you may need to reclick the button.
Horizontal/Vertical Scale Bar
To print a graphical scale bar in the axis title, check this box.
(max, calculated)
This is a calculated value that shows what the maximum value along the axis will be.  It is useful when entering the scale to make sure the log shows all the data.
(back to top)

Title Block

The title block information is used to print the title block in the lower left corner.  It is all defined in the template, however it may be overridden in the data file.

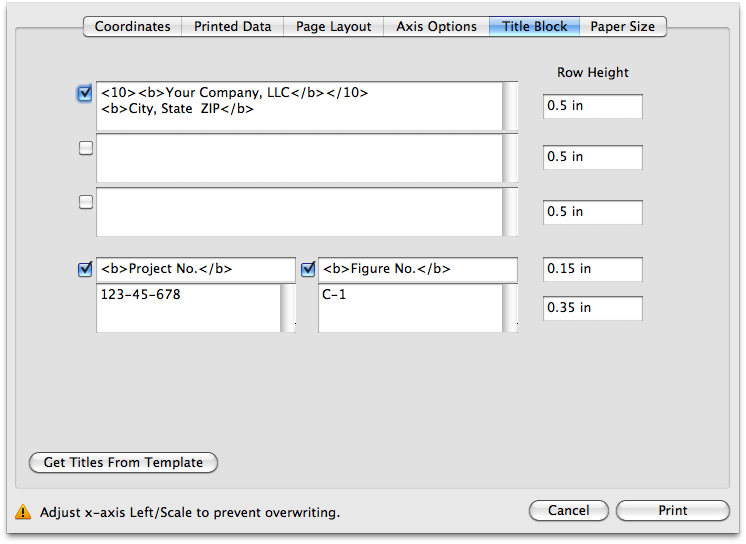
Title blocks next to a checked box will be printed, while those next to unchecked boxes will be ignored.  Boxes with checks will be printed directly on top of each other.  For example, in the above example, the "Your Company" data will be printed in the box directly above the "Project No." and "Figure No." boxes, despite the empty data field between them - note the unchecked boxes next to the empty fields.

The row heights determine how tall each printed row is.

(back to top)

Paper Size

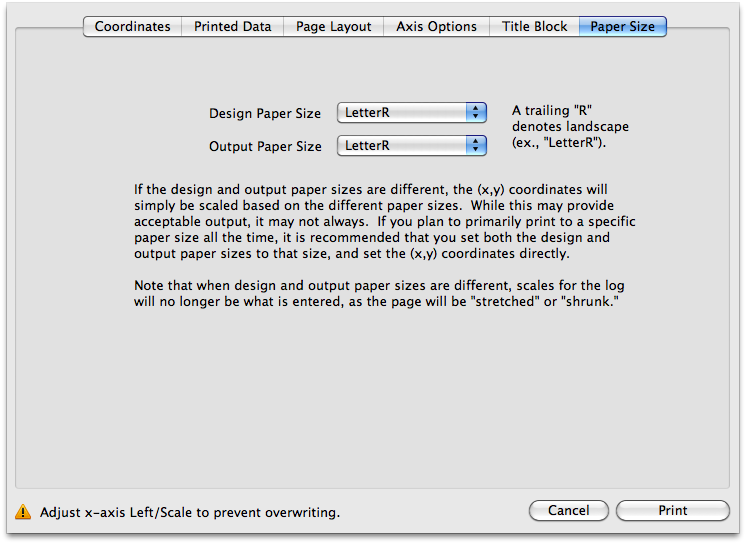
Define the paper sizes used for design and output on the Paper Size tab.

(back to top)

Printing the Fence Logs

After your input values are correct, click the "Print" button to print the logs to a PDF file and open them in your default PDF viewer.

(back to top)